Leaderboard


Popular Content
Showing content with the highest reputation on 2014-01-28 in all areas
-
Yet the empire lasted until the 15th century. I wouldn't use the word "scuppered".3 points
-
Pathfinder is definitely not made to handle such big maps right now. Graphics can probably scale up way better as long as there are not too many entities (frustrum filtering is slow) and there are many stuffs that are repeated (several of the same tree…). Range Queries should hold up somewhat well, though again as the number of entities grows it'll suffer. AI is probably similar.1 point
-
I like it.1 point
-
The tower must show that it doesn't cause any territory when the CC isn't close enough. So yes, it could represent the army camp, or an outpost where another CC build around. The main limitation of the "not causing territory changes" is that you don't see territory blinking anymore. So we'd probably need an other visualisation for decaying buildings.1 point
-
https://en.wikipedia.org/wiki/Celts#Gender_and_sexual_norms They had at least more power than Roman women.1 point
-
Well I guess we should be opening a topic for this. What I'd like to see in 0ad would be the ability to recruit medium and heavy units after researching the last technology. That way if you are out of money you can still manage to slow down your opponent1 point
-
Nice props =)1 point
-
Got an AI related error as well: Version: SVN 14696 Map type: Scirmish Map: Alpine Valleys AI: Aegis (easy) Civs: Macedonian(Player), Random(AI) Settings: Otherwise default settings Cache: Cleared before starting the game Local modifications: None Error: commands.txt system_info.txt mainlog.html interestinglog.html1 point
-
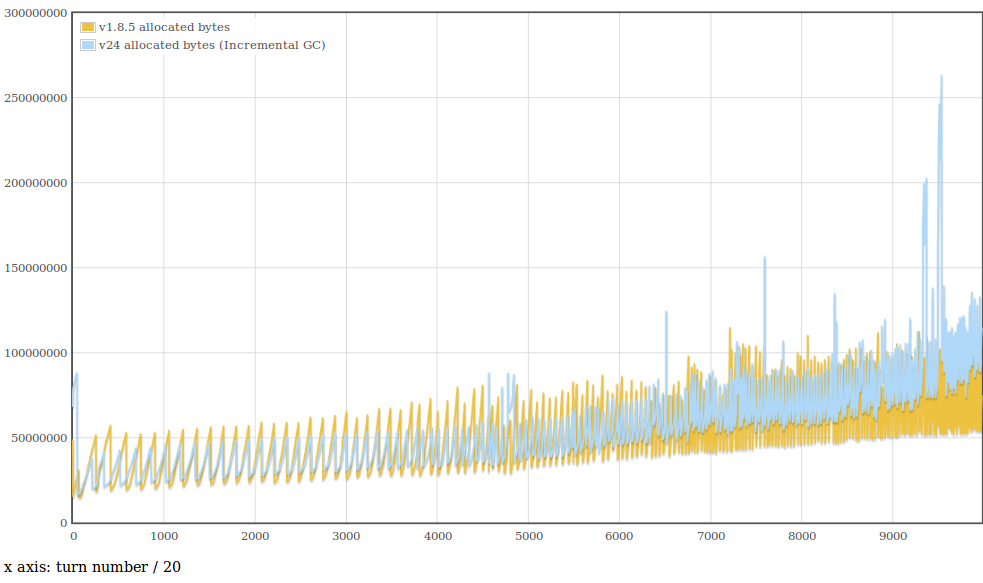
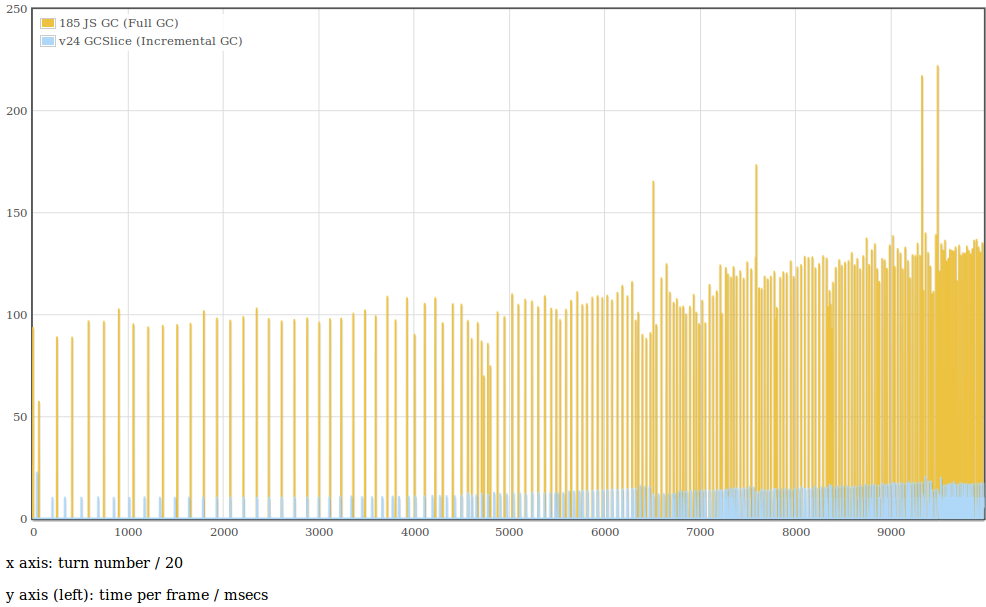
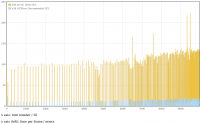
I've had a look at incremental GC. Incremental GC allows splitting up the garbage collection into slices and JS code can run between these slices. It doesn't make garbage collection faster in general, but it should avoid big lag spikes when too much garbage collection happens at once. SpiderMonkey uses a Mark-and-Sweep garbage collector. First, it marks garbage in slices (that's the incremental part), then it sweeps everything in another thread. It was quite a challenge and I wouldn't have a working implementation yet if terrence didn't help me on the JSAPI channel. He also opened a bug to add some more documentation. It looks like it's not yet figured out how API users are meant to configure incremental GC because Firefox accesses it quite directly. Anyway, I implemented a quite simple logic. If no GC cycle (the whole GC with multiple slices) is running and if the JS heap size has grown more than 20 MB since the last GC, we start a new incremental GC.We run the incremental GC in slices of 10ms each turn until it's done.The numbers can be tweaked of course. The part of measuring the heap size since the last GC isn't quite accurate though. What it actually does is setting the last heap size to the current heap size if the current heap size is smaller. That's because I didn't find a way to detect when the sweeping in the background thread has finished. So after the marking has completed, the heap is shrinking because the sweeping is running in the background. Here is a graph showing GC performance. I had to change the profiler to print the exact values each turn instead of printing an average over several turns. I've also changed v1.8.5 to run GC every 50 turns because I had to use only one runtime for measuring and the current settings wouldn't have worked. What we are measuring here are the peaks. It's quite a good result IMO, but it's hardly visible on the graph with total performance and with average values (because GC only runs from time to time). Btw. It's not a fault, this time v24 is actually better The next graphs show memory usage. V24 seems to use a bit more , but most of that is probably related to the GC behaviour. The peaks in the end could be because of the way I'm calculation the "last heap size" and because it takes several turns to mark the garbage before sweeping kicks in and actually frees it. Memory overview: Memory zoomed:

 1 point
 -
The stomach needs to sway a bit. That's why its so robotic. And his head needs to bounce more I think.1 point
-
The front legs are definitely OK. I'm not too sure about the rear legs. I feel they are a bit 'robotic' / static.1 point
-
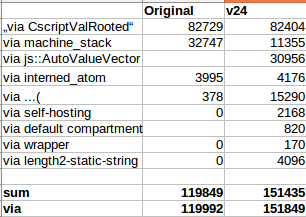
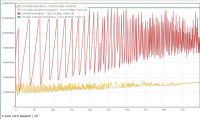
At the moment I'm trying to figure out if what we see on this graph is normal or not. I've reduced the number of GCs a bit because each GC call causes a more noticeable delay than with v1.8.5 (there are many flags to tweak GC though and I haven't tested them much yet). This graph compares JS memory usage of v1.8.5 and v26 during a 2vs2 AI game. V24 looks more or less like V26, so I didn't add that graph here. The used memory gets much higher because I've reduced the amount of GCs. More interesting than the peaks are the lowest parts of the graphs (after a garbage collection). I'd say that would be the amount of memory which is actually in use without counting memory that could be freed by a GC. It looks like V26 uses about twice as much memory as v1.8.5. It could be explained by the additional information stored by type inference and the JIT compiler. I don't know if such a big difference is normal for that. EDIT: I've dumped the JS heap on turn 1500 and ran a few grep commands to compare where the additional data in memory is coming from. I' don't know yet what it means...
 1 point
 -
i think that we can add other "bararian faction" Schytians! - Romans : *Imperial *Western Romans *Eastern Romans "Bizantines" * Celts: *Germans *Alemanni *Franks *Saxons *Goths * Pictish "britons" -Middle East factions: *Parthian *Sassanids Hindu: Gupta Empire * Steppe tribes: * Alans * Huns *Scytians -"unclasificated" *Dacians1 point