
Alex from Intel
-
Posts
9 -
Joined
-
Last visited
Posts posted by Alex from Intel
-
-
2 hours ago, stanislas69 said:
If you did manage to optimise our functions can you drop git diffs of the code you touched ? Maybe there is still little optimizations we can benefit from
")
I mostly fiddled around in Matrix3D.h, entirely replacing the contents of some functions with either calls to the Intel® Math Kernel Library or blocks of SSE intrinsics. I did not see any measurable improvement, but I've attached the file. The original code is left intact, commented out. Aside from these completely re-written functions, the only change is the addition of the <mkl.h> header.
SpoilerThe changed functions are:
CMatrix3D operator*(const CMatrix3D &matrix) const
CMatrix3D operator*(float f) const
CMatrix3D operator+(const CMatrix3D &m) const
CMatrix3D& operator+=(const CMatrix3D &m)
void Blend(const CMatrix3D& m, float f)
void AddBlend(const CMatrix3D& m, float f)2 hours ago, stanislas69 said:Maybe Itms can pull up a branch with Spidermonkey 45 (Here you are using 38) for you to run some profiling on.
Couldn't hurt.
2 hours ago, stanislas69 said:I don't think using debug symbols for Spidermonkey would help you find the bottleneck source
2 hours ago, nani said:So if Javascript code is the culprit can VTune profile what part of the js code is consuming time or how many interface calls does in average per frame?
Unfortunately I don't believe so. VTune Amplifier does have some JavaScript profiling capabilities, but as far as I know they're limited to node.js profiling. Also, I know pretty much nothing about JavaScript.
 2 hours ago, stanislas69 said:
What are your plans after this ?
I'm afraid while that JavaScript bottleneck is in place there's not much else I can do for 0 A.D. I do have enough from this to at least fuel the internal training session late next week. Depending on how that goes, I might produce a small how-to video/article based on this project. If I do, I'll be sure to post a link here.
-
 4
4
-
-
I have some good news and some bad news. The good news is that I've finished my analysis. The bad news is I can't really do anything about it myself.
After what I found last time I did some work trying to optimize the code, but I found that nothing I did had any measurable effect on performance. My changes caused individual functions to shuffle around a bit (and credit where it's due, the pathfinder did once pop up at the top of the list) in the Intel VTune Amplifier interface but I saw no improvement in the actual game.
SpoilerAs a side note, I did make a mistake while optimizing that temporarily resulted in an amusing bug.
So I took a step back, thinking maybe I missed something at a more basic level. Now, as I said in my first post, the reason for this project is that my team is, as a whole, relatively inexperienced with using our product on video games. We're more accustomed to scientific applications and the like. So I'd approached this the way I was used to doing, and went straight for the largest known hotspots, ignoring the unknown modules. I also focused on the lengths of the frames instead of the overall frame rate.
I conferred a bit with someone who was a little more used to the inner workings of video games, and re-evaluated my data. A large chunk of your time is spent in those unknown modules, and you have significant gaps between your frames - what's especially interesting is that if I filter my data down to only the gaps between frames, all the pathfinding, rendering, bone matrix manipulation, etc, drops away, and the overwhelmingly vast majority of what's left is "outside any known module". This kind of pattern can indicate that the bottleneck is an outside factor. Being a video game, the most obvious potential source is the GPU - it doesn't matter how efficiently calculations are being done if things end up waiting for the GPU to finish what it's doing.
So I ran a GPU/CPU analysis, but it showed that the GPU wasn't the problem. There were gaps in the activity there, too. So now I looked at the large number of threads involved in your game, most of which are not doing anything most of the time, and thought that might be the problem. So I ran a Threading analysis and saw that there were quite a few transitions between threads happening in those gaps between frames.
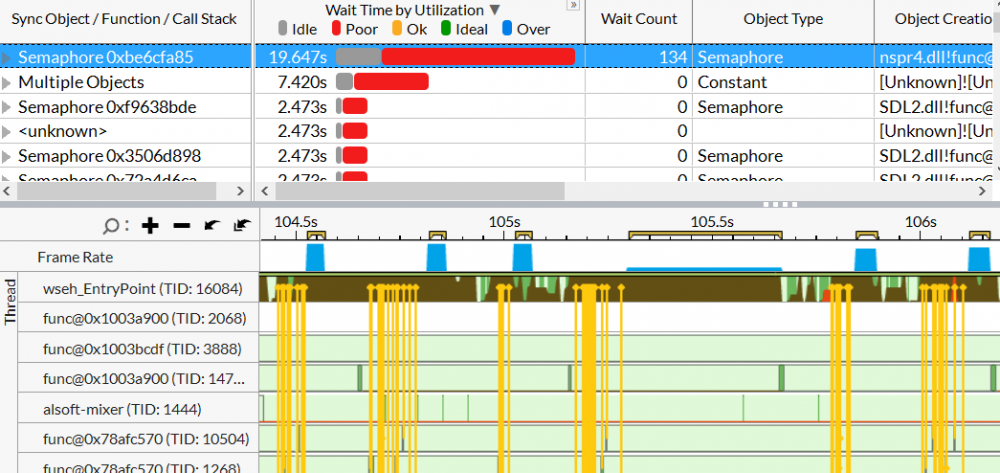
When I opened the call stacks for those top two objects, the call chains eventually went down into BaseThreadInitThunk (with the semaphore object going through a js::HelperThread::threadLoop function on the way).
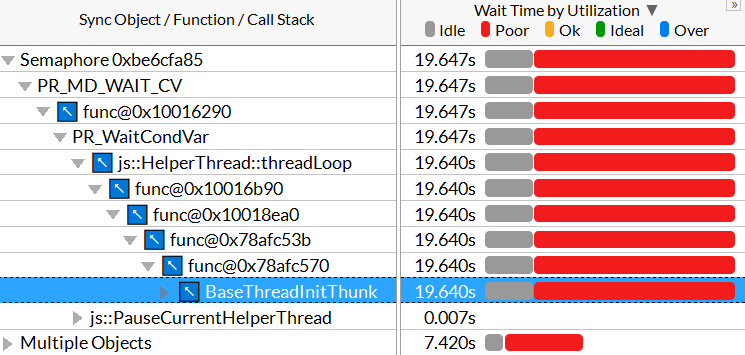
As I understand it, 0 A.D. is built on a mix of C++ and JavaScript code, and Thunking is a form of interfacing between two different types of code - such as two different languages. So presumably this is where your two languages are talking to each other.
So what I believe is going on here, is that these gaps between frames are coming from the game having to wait for the JavaScript. A couple possibilities I can think of are that you might be interfacing the two languages too often, or you might be doing computations in the JavaScript that really belong in the C++.
Unfortunately there's not much I, personally, can do to relieve that bottleneck.
Technically, I now have enough content to fulfill the barest requirements of my project. Before I continue I want to make it clear that I absolutely understand that you're on your own schedule and I don't expect anything from you! I just want to let you know about my own timeline, in case it affects your priorities or decisions.
If you guys do end up fixing your JavaScript issues in the next week and a half, please let me know and I would be more than happy to include the improved results in my initial presentation. If it gets done by mid-April, I would be happy to include a result comparison/improvement showcase in any official documentation I might produce from this, and if early enough, I might also be able to include a second analysis step.
Thank you all for your interest, and good luck!
-
5
-
-
25 minutes ago, vladislavbelov said:
It really depends on frame. Try to move the camera for some empty space. Or order all 1000+ units to move.
13 minutes ago, Itms said:it is not a surprise that the so-called short pathfinder is a bottleneck. There are plans to revamp or get rid of it, as it is a very old piece of code.
Thanks for the feedback. It may well be that the pathfinder occasionally bottlenecks the application under certain circumstances - but so far we've located a few functions that are consistently eating up the CPU time, so focusing optimizations on them is likely to bring better speedup overall. This is especially true since what I've seen from both of the pathfinding functions, they mostly suffer from branch mispredictions, which aren't really something you can optimize in most circumstances.
29 minutes ago, vladislavbelov said:1 hour ago, Yves said:I've worked on an OpenGL4 renderer that uses more modern features like instancing and bindless textures in 2016.
Unfortunately we have only 56% of players who support the GL4+.
@Yves Thank you for this gold mine of a post! I'll have to dive into what you've provided. Depending on the amount of work needed to complete your experiment (as I do unfortunately have a deadline for producing training material from this effort), it might be extremely helpful to me, even if it's not necessarily something that can be turned around and merged back into the actual game.
-
3
-
-
20 hours ago, nani said:
From what I know then the pathfinder becomes the most time consuming task for the CPU. Might be worth looking at it with VTune.
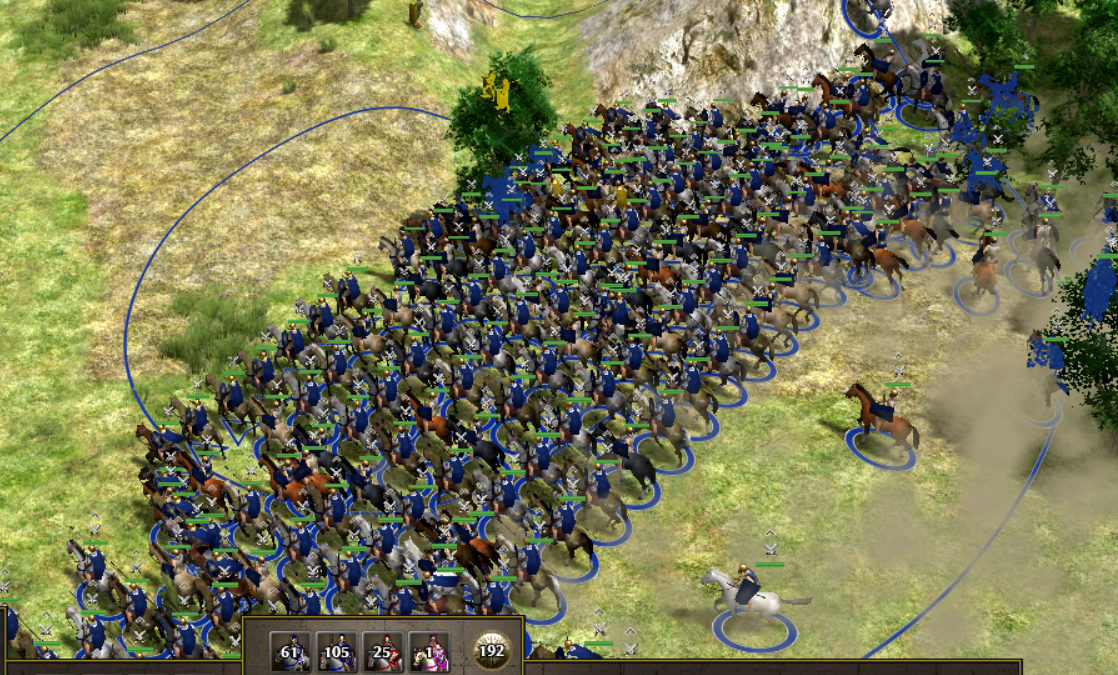
I took your advice and started a very large 8 player map and built up to a population just shy of 300 units. Unfortunately by then several other factions had killed each other off but there were still a sizable number of units from various factions (I know one of my allies had 200+ units from switching perspectives). I then marched a very large force through some trees and buildings and I could actually see the game struggling along at ~5 FPS under the strain of the computations, even without VTune Amplifier running on it.

(Also I might have a cavalry obsession)
But surprisingly... it doesn't look like the pathfinder is the problem (unless the problematic part of the algorithm is showing up through something else that it's calling - could it have something to do with the std::_Tree activity going on here?). Once again, the biggest identifiable hotspot is BlendBoneMatrices. Render is up there again too. This time I see Bind in the top hotspots as well (it's memory bound).
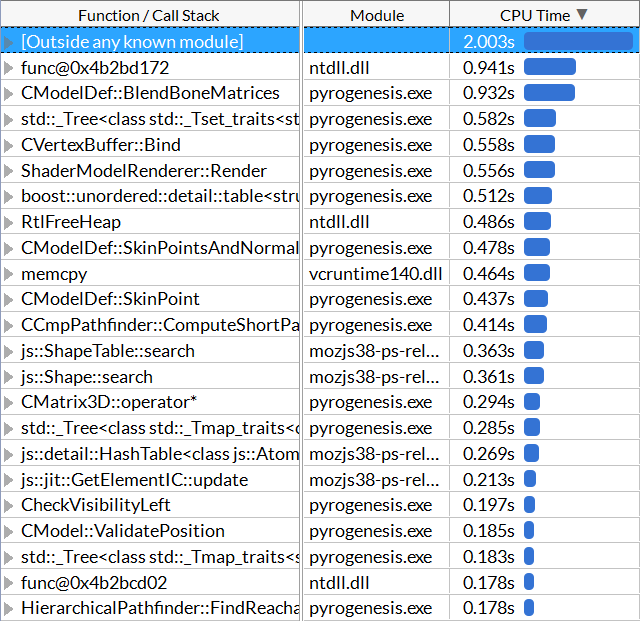
For the record, both the pathfinder functions I see here are listed as being bad-speculation bound, so that would make them rather hard to optimize (a lot of the time branch misprediction is unavoidable).
-
4
-
-
Thanks @nani! I'll definitely look into using larger test cases - but just for the record, the stated "115 units" is just the size of the army I'm directly controlling/moving. I have other units going about their business back in my city and no idea how many the other faction has running around (I'll have to pause the game in combat and see if I can count just how many Iberian units come rushing out to fend me off when I attack).
I suppose I should also mention that earlier (using a different VTune Amplifier result collected under different conditions), I did actually find CCMPPathfinder::ComputeShortPath as a hotspot! The cause of the bottlenecking, according to my analysis, was that this function was bound by branch misprediction. Unfortunately, after looking into the code for some time I was forced to conclude that there was nothing that could be done to mitigate the misprediction rate. I have not yet seen other parts of the path finder become hotspots but I'll try building a new test case on an 8-player map tomorrow. Honestly I was sticking to 2 player so far to allow myself time to actually build up a decent test case - I never said I was good at this game!
")
In other news, I was able to run a tighter analysis (with a sample rate of 0.1ms) on the slow startup portion. In that part, SkinPoint is definitely the main hotspot, followed by BlendBoneMatrices. SkinPoint is 49.9% back end bound, almost entirely core bound. None of that was attributed to the divider, though, so it's just plain port overuse. I'm currently investigating whether it might be possible to vectorize the offending loop, as that can dramatically cut down on the port traffic, but ultimately it comes down to whether the nature of the loop is vector-friendly.
-
4
-
-
For the sake of keeping track of things, and for easy access by the developers helping me out, I figure I should recap all my findings so far.
I started with the code as of February 1st, to which I added some VTune Amplifier ITT API calls to mark frames as well as place user events marking the durations of actual gameplay and the loading screen on the CPU timeline. This was the only initial change made.
My designated test case is a save file from a medium sized random Lake map featuring the Romans (myself) versus the Iberians (CPU). My standard test procedure is to select my army of 115 units, march them westward along the southern edge of the lake, and engage the Iberian forces.
SpoilerExact army composition, for reference:
- Veles x20
- Triarius x5
- Hastatus x32
- Eques Socius x8
- Eques Romanus x44
- Eques Consularis x5
- Marcus Claudius Marcellus x1
Perhaps it would have been better to use a bigger army but this was basically as far as I could get before I started running out of resources and the game was starting to sputter on my machine so I figured I was giving the CPU enough of a beating to produce usable VTune Amplifier results.
On filtering down the Microarchitecture Analysis result that I'm currently working from to only the actual gameplay portion, I found three general regions of interest: a slow portion immediately after the loading screen ends, normal gameplay, and a bizarre "gap" where no frames were processed at all.
Long version:
SpoilerOverall, the top five time-consuming functions originating in pyrogenesis.exe itself (as opposed to various dlls) were:
- CModelDef::BlendBoneMatrices
- ShaderModelRenderer::Render
- CModelDef::SkinPointsAndNormals_SSE
- CVertexBuffer:Bind
- CModelDef::SkinPoint
First, I filtered the results further to investigate the strange blank section in which cpu activity dropped like a rock and no frames were processed (not even a slow frame - just no frame at all). I noticed this section while actually collecting the result as the game froze for about four seconds in the middle of combat before proceeding as if nothing had happened. However, VTune Amplifier reports that the majority of activity during this section was coming from dlls, and I haven't seen this happen before. So for now I'm operating under the assumption that this was a one-off system fluke rather than a game flaw. For what it's worth, the top three functions in this section originating from pyrogenesis.exe were something in std::_Tree (not part of 0 A.D.'s own code), BlendBoneMatrices, and Render.
I also looked into the slow part at the beginning, where the most notable functions were BlendBoneMatrices and SkinPoint. Unfortunately this is a very small portion of the result, and I didn't have enough data to get accurate microarchitecture event breakdowns for this section. I may see if a tighter analysis with a faster sample rate produces interesting results.
Finally, I filtered data to only represent the normal gameplay (a chunk of time in between the slow start and the dead zone). Here the top functions were the same as for the overall results.
Short version:
I've written the dead section off as a fluke (and I don't think it could be optimized anyway). The slow part at the beginning needs further analysis to see if I can get meaningful data. I've concluded that CModelDef::BlendBoneMatrices and ShaderModelRenderer::Render are the primary functions to investigate.
Analysis of Functions:
BlendBoneMatrices assessment:
SpoilerBlendBoneMatrices is primarily back-end bound (at 48.1% of pipeline slots), which basically means the CPU is getting and reading instructions faster than it can actually process them, either due to not being able to fetch the appropriate data fast enough (memory bound) or not being able to do the computations fast enough (core bound). This function is pretty evenly split between the two causes, at 21.4% memory bound and 26.7% core bound.
VTune has identified the primary hotspots as lines 223 and 221, which are fairly similar. Both of these lines are roughly the same form, calling boneMatrix.Blend and boneMatrix.AddBlend. These basically just boil down to matrix math done with a CMatrix3D class that looks very strange to me. There are two equally plausible possibilities here:
- The person who designed this class is a wizard and knew exactly what they were doing, and this looks strange because I don't understand its brilliance, or
- This method of laying out your matrix data is as weird as it looks, and overhauling this structure will bring performance improvements.
I'm honestly a bit afraid to touch it because in either case, this is a fundamental and low-level structure and tampering with it may break everything.
I do know that Intel has a hyper-optimized math library that does some matrix magic but I don't know whether MKL could (or philosophically would) be used in your open source game. I will have to look into this.
Render assessment:
Render is more complicated. It's overwhelmingly back-end bound (89.8% of pipeline slots) and almost all of this is memory bound (81.4%). Digging deeper into the numbers it's 74.6% DRAM bound, which essentially means that it's slowed down mainly by missing the last level cache quite often. Even more abstractly, it's not accessing data in an efficient way.
It's a fairly long function and it had several hotspots in it.
Hotspot #1, line 446
Spoilerconst CShaderConditionalDefines& condefs = model->GetMaterial().GetConditionalDefines(); for (size_t j = 0; j < condefs.GetSize(); ++j) // This one is line 446 { const CShaderConditionalDefines::CondDefine& item = condefs.GetItem(j); int type = item.m_CondType; switch (type) { case DCOND_DISTANCE: { CVector3D modelpos = model->GetTransform().GetTranslation(); float dist = worldToCam.Transform(modelpos).Z; float dmin = item.m_CondArgs[0]; float dmax = item.m_CondArgs[1]; if ((dmin < 0 || dist >= dmin) && (dmax < 0 || dist < dmax)) condFlags |= (1 << j); break; } } }
This one is pretty baffling for me. There seems to be a lot of time spent on the actual loop control line (446) but:
- VTune Amplifier has no data recorded for the lines actually inside the loop, in either source code view or assembly code view
- When I put a breakpoint on the "for" line, and ran the game through a debugger, it triggered constantly, but when I put breakpoints on all the lines inside the loop and played the game for a while, no breakpoint ever triggered.
- Only some of the lines inside the loop had assembly code associated with them. Many lines were simply not present in the assembly at all.
- No assembly exists for line 445, the part that actually retrieves condefs. I don't know if this means the compiler optimized it out or just directly merged it into 446 (though the latter makes more sense).
So all evidence points to this loop not ever running, which makes the presence of a hotspot on its control line rather baffling. It's possible, I guess, that the loop never runs but the initial conditional check is still running (this code chunk does exist within another loop and is in the Render function so it's probably getting called a lot). It could also be a case of event skid (basically, due to the way VTune Amplifier measures, sometimes data is linked to a line a couple assembly instructions after the one that actually generated it) but I have no idea where it would be skidding from.
I haven't dived so deeply into the other hotspots of note in this function.
SpoilerHotspot 2 (line 763)
ENSURE(rdata->GetKey() == m->vertexRenderer.get());
Hotspot 3 (line 668)
size_t samplersNum = samplers.size();
Hotspot 4 (line 692, the "if")
if (texBindingNames[s] == samp.Name && bind.Active())
{
  bind = texBindings[s];
}
So that's pretty much what I've got as of right now.
-
3
-
 2
2
-
Thank you for your response, @Itms! I'll definitely try the IRC channel. I'm usually available 9am-4pm PST, meetings and other duties notwithstanding.
I'll keep your offer in mind if Legal needs additional information. Honestly I don't expect there to be any issues, though!
-
Hello, 0 A.D. community! I'm a Technical Consulting Engineer at Intel Corporation, and I need your help.
In short, I'm reaching out to you in the hopes of finding 1-3 developers familiar with the 0 A.D. code base to work with me on optimizing your game using Intel's software analysis tools, specifically Intel® VTune™ Amplifier. While I won't be contributing any patches personally, and do not intend to be a long term developer, you are more than welcome to keep and submit any optimizations we make as part of this project, free of charge. In particular I'm interested in optimizing the functions BlendBoneMatrices, Render, and possibly also SkinPoint.
A little bit of background for you. Intel® VTune™ Amplifier is a sampling-based analysis tool used to measure performance and locate/diagnose bottlenecks in code. Unfortunately, Intel has a bit of a deficiency in documentation for using this tool on graphical applications like video games (a problem in and of itself already), which in turn leads to the additional problem of a lack of familiarity with this use case in the employees tasked with supporting the product.
Currently I am attempting to remedy the second problem by creating an Intel internal training demo for using Intel® VTune™ Amplifier on video games. In theory it should be simple: find a suitable game, run the analyzer, optimize appropriately, show off the results. After some searching around I settled on 0 A.D. as a good candidate for this purpose, and I've been collecting plenty of data on it (it's also a great excuse to play a really fun RTS at work
). I've been able to identify some bottlenecks worth investigation and I've diagnosed the causes to varying degrees. But this game is a... very big project, and that's where I got stuck. I'm brand new to this code base and while I know (or at least suspect) what needs to be fixed, I don't know how to do it.
This is where you come in. With your assistance, I hope to understand how to implement these optimizations, since you know the code much better than I do. Again, you're perfectly welcome to keep whatever optimizations we come up with.
While the current goal is to create an internal training demo, ideally I hope to create official public documentation on the Intel Developer Zone website as well, such as a tutorial or video, using 0 A.D. as the example application. Assuming Legal gives me the go-ahead after reviewing the game's licensing conditions, I would be more than happy to give you credit for your assistance (should you request it) in this context as well.
Please let me know if you're interested in assisting. I would be happy to provide more detailed information about the bottlenecks I've identified, as well as access to Intel® VTune™ Amplifier, my analysis result files, and the 0 A.D. save file I've been testing on.
*I'd like to make it clear that I am acting here as an individual employee of Intel Corporation pursuing a work-related task, but I should certainly not be taken as an official representative of the company as a whole. I am "Alex from Intel", not just "Intel"!
-
13
-

Help needed: Optimizing 0 A.D. with Intel VTune Amplifier
in Game Development & Technical Discussion
Posted
I have finally made this into an actual piece of published collateral. It is not much, but as promised, here it is.
This is probably the last you'll hear from me, so thanks once more for all the help, and have a good one!