

Yves
-
Posts
1.135 -
Joined
-
Last visited
-
Days Won
25
Posts posted by Yves
-
-
I've worked on an OpenGL4 renderer that uses more modern features like instancing and bindless textures in 2016. My conclusion was also that the renderer is a bottleneck and it's mainly memory bound. I've even tried Intel VTune Amplifier, but switched back to Perf later. By changing how we pass data to our shaders and reducing the number of draw calls, I was able to reduce that overhead by a lot. Unfortunately my work never got beyond the experimental stage. I've written a small blog in the staff forums. I've copied the two most recent post here, if you're interested (still from 2016).
The code from the experimental OGL 4 branch is still around on github: https://github.com/Yves-G/0ad/tree/OGL4
Post10: January – Profiling, profiling and ... profiling:
SpoilerPost10: January – Profiling, profiling and ... profiling
In January, I did some patch reviews and only started working on the rendering branch about two weeks ago. I still had to find some better ways of measuring performance accurately. Figuring out if a change improved performance or not is the minimum requirement, some ways for measuring what improved exactly would be nice to have.
Testing Intel VTune Amplifier XE
Philip suggested this profiler from Intel and I gave it a try. It costs around $900, but there's a free 30 days trial and free licenses are available for non-commercial open source developers.
The profiler is relatively easy to use and it supports the developer in many ways. Context sensitive help gives information about how to use the profiler and how to interpret data, the sampling based profiler clearly indicates if there are too few samples to be statistically relevant and the software even knows enough about the processor and the collected data to make suggestions what values might indicate potential problems.
My problem was just that I couldn't use any of the fancy features because my development machine doesn't have an Intel CPU and no Intel graphics chip either. All I could test was the basic sampling profiler, which can't do more than what I already did with perf. In the end I stopped using VTune and went back to perf.
The first step: Using absolute counts from Perf and a fixed frame to turn ratio
Something else Philip suggested was setting up a fixed frame to turn ratio for the profiling and using the absolute cycle counts of perf. When measuring per-frame values using the in-game profiler, it doesn't matter how many frames you render (well, it did because of the buffer initialization thing described in the previous post - this was one reason why these measurements weren't very accurate). When using absolute counts (cycles, instructions etc.), the total number of frames matters very much. If making it faster means rendering more frames, the per-function counts would increase instead of getting lower.
What I did was hard coding the variable "realTimeSinceLastFrame" to 0.2 / 0.5. In singleplayer mode, a turn takes 200 ms, so this means 5 frames per turn. For my autostart-benchmark of 75 turns, that's 375 frames (actually 376 in practice).
This way I could get relatively stable results just by measuring the total runtime or by counting the total number of cycles using "perf stat":
perf stat -e cycles ./pyrogenesis -autostart=scenarios/DeepForestProfile -autostart-players=4 -autostart-finalturn=75 -nosound
Example output:
    58'813'616'438 cycles
    23.295729288 seconds time elapsed
The average values of several runs shows that the SVN version is about about 0.25 seconds or 1.1% faster than my development branch with Open GL 4 disabled.
Repeating the measurement later gave similar results: 0.21 seconds or 0.9%.I wanted to further improve the accuracy by configuring perf to start collecting events after loading the map instead of from the beginning. It takes about half of the time just to load the map, so that would have helped a lot. Unfortunately perf doesn't support that yet. It could work using Toggle Events, but apparently these are only implemented in a custom branch. Otherwise the only way seems to be using the Perf API from C++. Both approaches seemed to be a bit too cumbersome for the moment.
Second step: Any other useful events?
After I got it working this way, I suddenly realized that Perf had many more events available to collect and I could, for example, measure changes in the number of cache misses. So far my experience was that these events are hard to use with "perf record". One of the difficulties is that you have to pick a reasonable frequency for the samples to avoid influencing the performance too much and to get enough samples for statistical significance. However, when using perf stat you don't have to worry about that. It just collects the absolute values and doesn't have to collect samples as with perf record.
As I mentioned earlier, Perf lacks some good documentation, so the available events weren't very useful. For example, there's an event called "cache-misses", but it doesn't say if these are for the L1, L2, L3 or the TLB cache, or maybe a combination of these. It also doesn't say if it's just the data cache or also the instruction cache.
After some tinkering and reading, I figured out how to access the CPU events directly. The AMD BIOS and Kernel Developer's Guide describes "Event select" and "Unit Mask" values used to get specific events. There are different documents for different CPU families and the Unit masks and Event Select values might be different depending on the exact processor model and stepping. Using Wikipedia and some data from my hardware, I figured out that I need to look into the guide for the AMD 10h family of processors and my CPU is a Phenom II X4 with a Deneb model and C2 stepping.
For example, on page 468, it describes EventSelect 4E1h for "L3 Cache Misses". Below, there's a list of some Unit Masks to further narrow down the collected events.
01h Read Block Exclusive (Data cache read)
02h Read Block Shared (Instruction cache read)
04h Read Block Modify
10h Core 0 Select
20h Core 1 Select
40h Core 2 Select
80h Core 3 Select
To select events from all cores and choose "Read Block Exclusive", you would combine the flags like this: 0x01 | 0x10 | 0x20 | 0x40 | 0x80 = 0xF1
To pass them to Perf, you use the "-e" parameter, prefix the values with "r" and append the Unit Mask followed by the Event Select value: rF14E1The advantage is that you have the description of the events from the supplier (AMD) directly instead of having * no description at all * from Perf.
Third step: Profit!
")
Ok, it's time to use the new knowledge.
Compare some potentially relevant events using perf stat (L1, L2 and L3 cache misses):
perf stat -e r41,r27E,rF14E1 ./pyrogenesis -autostart=scenarios/DeepForestProfile -autostart-players=4 -autostart-finalturn=75 -nosound
I made several runs and calculated the difference between the average values from SVN to my branch without the GL4 code enabled.
~ -1.1% L1 misses in branch
~ +1.5% L2 misses in branch
~ +8.8% L3 misses in branch
~ +1.5% time for branch
I don't know why there are less L1 cache misses, but it's a small value, so it might not even be significant. There's quite a large difference in L3 misses, though. The difference was there in each measurement, not just in the average value, so it seemed possible to use perf record to figure out some more about where it comes from.
I tried using perf report to figure out where the L3 cache misses happen.
perf record -e rF14E1 -c 1000 ./pyrogenesis -autostart=scenarios/DeepForestProfile -autostart-players=4 -autostart-finalturn=75 -nosound
Just comparing the top functions, already revealed quite a lot:branch:
 15.14% 3528  pyrogenesis  fglrx_dri.so         [.] 0x00000000015f0a89
 12.60% 2936  pyrogenesis  pyrogenesis          [.] void std::__introsort_loop<__gnu_cxx::__normal_iterator<CModel**, std::vector<CModel* ...
 15% 2599     pyrogenesis  [kernel.kallsyms]    [k] 0xffffffff811c9384
 3.73% 870    pyrogenesis  pyrogenesis          [.] CUnitAnimation::Update(float)
 2.56% 597    pyrogenesis  libc-2.19.so         [.] malloc_consolidate
SVN:
   16.82%   3876  pyrogenesis  fglrx_dri.so        [.] 0x0000000000f1c62c
   12.29%   2833  pyrogenesis  pyrogenesis         [.] void std::__introsort_loop<__gnu_cxx::__normal_iterator<CModel** ...
   10.37%   2389  pyrogenesis  [kernel.kallsyms]   [k] 0xffffffff81174124
    4.00%    921  pyrogenesis  pyrogenesis         [.] CUnitAnimation::Update(float)
    3.08%    710  pyrogenesis  pyrogenesis         [.] ShaderModelRenderer::Render(std::shared_ptr<RenderModifier> ...
    2.55%    588  pyrogenesis  libc-2.19.so        [.] malloc_consolidate
That kernel entry ("kernel.kallsyms") is probably overhead from Perf collecting the events. The overhead grows when it has to collect more events, so it gets bigger as the number of cache misses in other functions increase. We already know that the graphics driver is a performance problem (fglrx_dri.so), but I don't quite understand why there are so much more cache misses in SVN for it.
The difference in the functions for sorting models during rendering is the most interesting part and probably the source of the problem. I have moved the m_Material member from CModel to CModel abstract, so it's now further away from another member (m_pModelDef) that is also accessed in that sort function. This is already fixed in my cache efficiency patch, so we should get back the performance when I commit that to the branch. I'll make another measurement to confirm that assumption when I'm ready to commit. In addition, it might be worth to try some other cache efficiency optimizations for the data used in that model sort function.
Post 11: 10th of July - Bindless textures and instancing:
SpoilerPost 11: 10th of July - Bindless textures and instancing
I haven't posted here for a while, but I've continued working on the GL4 branch and, in particular, on instancing and bindless textures. I've focused more on the OpenGL and driver related code again because this is still the main bottleneck of the renderer. A lot of time is still spent in the driver and even some of the slower parts of our code could probably be improved using the same techniques that can be used to reduce driver overhead. Besides, fine-tuning the cache efficiency is probably a waste of time at this point because the code that would benefit the most from it is going to change anyway.
Instancing
The idea behind instancing is to give a batch of work (multiple 3D models to draw) to the driver together with all the required data rather than setting up each model one by one. This should be more efficient because the driver has to do less validation work per model and it's usually also more efficient to transfer a large amount of data at once rather than transferring the same data in small pieces.
Imagine a game of chess with black and white pieces (king, queen, pawns etc.) that have to be rendered by our engine. Our current approach was like this:
- Set the model: knight
- Set the color: white
- Set the position: 1/0
- Draw 1st white knight
- Set the position: 6/0
- Draw 2nd white knight
- Set color: black
- Set position: 1/7
- Draw 1st black knight
- etc...
This requires a separate draw call for each piece, so 32 draw calls. Changing colors, models or the position requires driver validation each time. We've optimized that by sorting the pieces (models) as efficiently as possible. For example, we could first draw all white pieces or sort by model and draw all pawns without having to switch the model.
The GL4 branch uses a different approach. All data gets stored in buffers and is accessible through a draw ID. So far it still has to use the old sorting approach for models because these can't be switched from within the driver only (at least that's not implemented in the branch yet). Other than that, it can prepare all the data in buffers and then draw all the same models at once with a single draw call. So in the chess example, it would be like this:
Preparation:
- Sort by models
- Prepare buffers containing color and position for all models
- Upload the buffers and make them available to the GPU
Drawing:
- Select model: knight
- Draw 4 knights using the prepared data
- Select model: pawn
- Draw 16 pawns using the prepared data
- etc...
Bindless textures
The chess example above is a bit simplified. Instead of using a simple color, we use textures for most of our models. These textures have to be bound (selected/activated) before each draw call which makes instancing impossible for models with different textures. Bindless textures are a solution for this problem. Essentially you generate a handle for your texture and make the texture resident (only resident textures can be used in shaders). The handle is a uint64 value that can be passed to shaders using uniforms or SSBOs. The shaders can use these handles just as other texture samples which have been bound the old fashioned way.
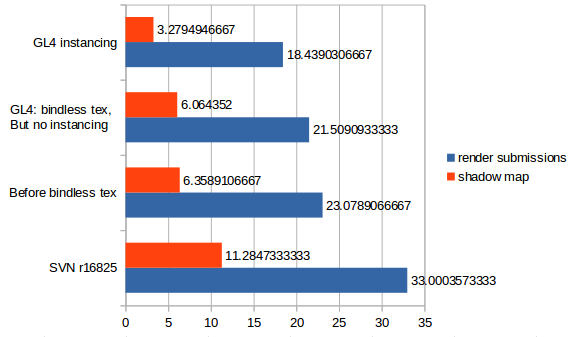
Current state of the GL4 renderer
Currently, bindless textures and instancing are implemented for the model renderer. Multiple draw calls are still required for model or shader changes.
Here's a performance comparison between different version of the branch and SVN on the map Deep Forest. It shows how long in milliseconds the respective sections in the renderer took in average (shorter is better). The "render submissions" section basically encompasses all the rendering and "shadow map" is only for the shadow map rendering within the model renderer.
-
 4
4
-
 4
4
-
As I've mentioned a few days ago on IRC, I'm also working on a battalion system. We might be able to share ideas and code, if you don't mind. I've only had a brief look at your code on github. I might want to copy parts of it, especially the battalion selection code. Is that OK for you?
I've uploaded the current state to github: https://github.com/Yves-G/0ad/tree/BattalionSystem
Feel free to copy if you find anything you can use. It's still very experimental and unfinished in the current state. There's a demo map included with (currently) just two melee battalions that can attack eachother.-
7
-
-
Between Spidermonkey 1.8.5 and 38 there have been many profound API changes and it took us countless hours to adapt the code to these changes. The GUI was especially difficult because it used a wider range of different API functions for the object oriented aspects. During the upgrade we have reduced the complexity of this interaction, which helped streamline the upgrade process in the future.
You have valid points for the object oriented approach and I'm not against it, in principle. I just advise to keep the upgrades in mind an avoid adding too much complexity and diversity to the C++ <-> JS interaction. I don't know how much the Spidermonkey API keeps changing nowadays, but given how much Javascript is still changing, I suspect that's still an issue.
-
2
-
3
-
-
I had loading times of 40-50 seconds for a few days and now I'm getting http 503 too. I'd guess there's a performance issue with the forum database because files load quickly and other parts of the forum are also relatively slow (like around 10 seconds loading time).
-
1
-
-
You answered my question only partially.
")
So far you have identified most issues with the current gameplay and you have outlined some possible ways for fixing them. That's a good start, but it's still quite far away from a concept that can be implemented. Decision have to be made where multiple alternative solutions have been suggested, dependencies between features have to be identified and clarified, detailed descriptions have to be written per feature etc. If developers want to help, they need very specific and detailed information how a feature should work. Do you think it's realistic to design such a concept, write it down and then also implement it in roughly 6 months (I guess 3-6 is too ambitious)? As I said, it would not be complete yet, but it should be complete enough to give a good impression of the final gameplay. If you don't know how long it would take to implement something, that's fine. you could still estimate how long it would take until the first parts of the concept are finalized enough so that someone can start with the implementation and how long you'd need for the whole concept.
-
3
-
-
Do you think it would be possible to implement your suggested changes in a proof of concept mod/branch in relatively short time of around 3-6 months? The scope would have to be limited as much as possible without leaving out anything that is crucial for the gameplay as a whole. For example, it could only focus on one civ, placeholders could be used instead of new artwork and workarounds or hacks for difficult features are OK. What tasks would have to be done exactly and how much help would you need from the team?
We are still discussing your application in the team and I can't give you an official answer yet, but such a proof of concept implementation seems to be well supported. The tasks required for it (further work on the concept, setting priorities, defining tasks) are the next step anyway, so it should be ok to get started with it.
-
4
-
-
I'm looking forward to reading that document!
The lack of a coherent gameplay design is the main issue that prevents us from going to the beta stage and eventually releasing a 1.0 version in my opinion. We need someone with dedication for this task!
I've been working on game design for several weeks but then got stuck with a problem I haven't been able to resolve yet. There has to be a plan who could implement missing features in a reasonable timeframe, otherwise it's not going to work. As soon as your design includes some very though technical requirements, this becomes an issue. In my case, I felt that fighting mechanics in this game are quite dull at the moment and I wanted to include some formation fighting mechanics (see: http://trac.wildfiregames.com/wiki/FormationsWip). When looking at the technical aspects, I realised that all our pathfinding code is currently designed around single unit pathfinding. The formation system we have is basically a hack that works more or less OK in most cases, but it would require a major overhaul to meet the quality requirements for such a formation fighting system. Because the fighting system has such a strong impact on other aspects of gameplay, I stopped working on the design and started looking into pathfinding.
How would you handle such issues? It's always a possibility to work around such technical problems with the design (drop formations, reduce population cap). You actually see that a lot in commercial games. One part of me thinks that perfectionism is misplaced here (if large companies with big budgets do it, why shouldn't we?). On the other hand, I'd like to strive for more than just another generic RTS that copies the same mechanics we have seen in commercial titles for years or even decades now. Maybe both is possible with a very clever design...
-
5
-
-
Hello and welcome!
I like it, that's a nice addition to the hawks which already fly around in some maps. I'm a programmer and not really qualified to give feedback about art, so I leave that for one of the artists.
1 hour ago, JosCanPer said:EDIT: Can we use alpha for the textures? The wings and tale would look much better with feather shapes :/
Yes, you can.
Have you already taken a look at the existing hawk actor xml here? -
Looks like the perfect testcase for the instancing I'm working on.

-
1
-
-
I don't had anything specific in mind for multiplayer. It's maybe just because I think that multiplayer games are way more interesting than single-player games. They are more dynamic, more surprising and more challenging (even though wraitii, mimo and the others did a very good job with the AI
) .
My comment about tutorial videos was just my personal preference. If you have something in mind, go ahead and give it a try.
-
1
-
-
In my opinion, tutorials how to play the game aren't particularly interesting. There are some around already and even though I've enjoyed watching some let's plays on Youtube, I've never watched a pure tutorial video about a game on Youtube. In addition, gameplay is still changing quite a bit and tutorials could be outdated soon.
Traditional let's plays don't seem to work very well for 0 A.D. either. We don't have a single player campaign yet and only some multiplayer videos were really interesting to watch for me.
What really sets us apart from other games is how our development works. There's regularly new content to showcase and gameplay frequently changes because of new features or balancing changes. Something like the development reports, but in a video format, could work and could also attract new developers. You can search in the Announcements and News forum for these development reports. I'd say some well commented multiplayer matches would also work and modding or creation of a custom map in our map editor, but I don't know how well the modding and mapping suits you.
EDIT: These guys do it pretty well with development reports in video form: wolfire.com
-
A problem with writing to the config file could be. It would be user.cfg, not local cfg and for the Mac it's in "~/Library/Application\ Support/0ad/" according to the wiki.
-
1
-
-
I didn't know we take Bitcoin donations.
Everything about donating is described here: http://play0ad.com/community/donate/
EDIT: I misunderstood your question. I thought you wanted to donate but don't want to use Bitcoin but it appears you meant the opposite.
-
Part of what you describe seems normal. The Javascript engine, for example, schedules a Garbage Collection (GC) regularly. During GC, it reclaims unused memory, but it only gives it back to the operating system from time to time. If I remember correctly, it should not go beyond 400 MB, though. But there are other parts of the game that do similar things like the VFS (virtual filesystem). The VFS keeps some data in the cache because it takes longer to load it from the disk than loading it from memory.
So it doesn't work to look at memory usage in the first few minutes after the game is started and then calculate a memory growth rate based on that.
But...
Left overnight it consumed my 8GB RAM + 8GB swop partition.
This must not happen and is a bug.
When did this happen? Was it in the menu, in the multiplayer lobby or during a game? If it was a game, was it paused?
-
These ideas look interesting and I also don't like how the current system encourages to have so many traders.
However, in my opinion the system should be somewhat self-explaining and it should be possible to understand how it works without looking at number too much and certainly without making calculations.
Facts like these are hard to figure out for players:
-Markets generate income based on "connections" with other markets.
-Traders increase this "connection".
-You can only build one market per CC.
The basic idea isn't that hard to get, but how can you influence the number of connections exactly, how much benefit do you get from an increased number of connections and is there a difference between own markets and allied markets? It's hard to explain these things to players in a mathematical formula. Restricting the number of markets by CC seems to be a bit arbitrary, especially considering that some civs just have these smaller military settlements.
I liked the separate "trading good" resource because it's something which is easier to understand by players. What about having different trading goods as a less abstract way of explaining these "connections"? You'd get more profit if more different types of trading resources are connected to your market.
- These trading resources could be placed by the map designer and whoever owns the resource could build a market close to (or on) it and trade it (kind of like in Riese of Nations).
- Or it could be that each player can trade one or more predefined types of these resources and the only way to get more different types is to trade with allies. In this case we'd have to find a solution for how the distance between markets affects the system. It could require more traders to operate a short trade route (less profits if you sell the resource close to where it's being produced).
- Or these two approaches could be combined and there would just be some generic "trading camps" on the map where the players could build their markets and trade their own trading resource(s).
This is just some brainstorming and it would still require quite a bit of work to get to a solid concept.
In any case I'd probably reduce the maximum number of markets to a very low number. Generating profit there should be more about setting up an efficient trade network and not just about building more markets and more traders.
-
1
-
If you only want to patch you should get development version (SVN).
The development version is for developers and modders. If you just switch to SVN because you want to download only the differences between Alpha releases, then you end up downloading much more.
-
1
-
-
At the moment we are limited on the CPU side by the number of objects and not the polygon count of these objects. At least that's true for dedicated graphics cards.
In my OpenGL 4 branch, I'm working on reducing driver overhead with OpenGL 4 functionality such as glMultiDrawElementsIndirect. So far, I've only worked on the aspect of uniforms and don't even do real instancing yet. Still, this has already improved performance quite a bit. I hope and expect to see some more improvements by introducing bindless texture management, which should then allow real instancing.
In my opinion, it doesn't make much sense to work on a LOD system, before we overcome these limitations.
-
4
-
-
Hello Mikita and welcome!
As Stan already said, programmers usually just pick a task and submit one or more patches before they eventually get invited to join the team.
You may want to pick a simple task (link) or fix a bug to start with. If you are interested in a specific task, you may also work on that.
Is there anything you are particularly interested in (AI development, GUI programming, network code, rendering etc.)?
-
Currently we have a Jenkins master server and one Windows slave. We just use it for the Windows autobuilds so far, but there are some more ideas how it could be used in the future. Some tasks like installing a Linux slave, building and running the tests is on my todo list, but not quite on top.
-
Thanks for testing, I've committed the fix in r17067.
-
Hello Etzard
Thank you for reporting! You are right, it's a bug.
Would you mind testing the attached patch?
Please make sure to revert your fix before applying the patch and run build-osx-libs.sh with --force-rebuild.
I don't have a Mac and can't test, unfortunately.
-
I recently found this paper (around 100 pages) from Ulrich Drepper named "What every programmer should know about memory". It was very interesting and I red most of it in three days. It's not specifically about memory pools, but covers many performance aspects of memory and I learned a lot from it.
Online-Version: http://lwn.net/Articles/250967/
PDF Download: http://lwn.net/Articles/259710/
I'm sure that improving memory efficiency can help us a lot to improve performance. However, I would first try to pick some spots where you can prove that memory is the bottleneck and then try to resolve the problems there. Just adding a whole memory pooling system for everything sounds like a lot of work with possibly little effect on performance. To cover everything, a solution has to be generic and the real problems might need more specific solutions.
-
1
-
-
The first example in the codeprojects article is quite strange. Doesn't it just change from heap to stack allocated memory? It does avoid searching for free memory on the heap because it can just add sizeof(CTestClass) to the stack pointer, but I wouldn't call this a memory pool, not even a "simple memory pool".
-
We tried playing together inside the same house/same internet connection. We tried connecting through the lobby.
I don't think this is supported at the moment. You share the same public IP address when you use the same internet connection.
If you want to play LAN games, you should do it this way:
- One player hosts using "Multiplayer->Host Game" from the main menu
- The others connect to his internal IP address using "Multiplayer->Join Game" from the main menu
The internal IP is something like 192.168.1.5 (4 numbers between 0 and 255 separated by dots).
You can get it with the ipconfig command on Windows or ifconfig on the Mac (if I remember correctly).
This is different from the public IP address which you can get if you browse to this website for example (you don't need this address in your case): http://whatismyip.org/
-
3
Re-introduction
in Introductions & Off-Topic Discussion
Posted
Great news! Welcome back, Ben!
Of course I remember you. You helped me with my first patch (premake upgrade) and I joined the project after that!